Memory Profiling Go Programs
Lately I’ve been doing some memory optimisations for Go programs, and Go’s pprof tool has been invaluable.
In this post, I’ll talk a little bit about how you can use pprof to profile memory usage in your Go programs.
I’ll also point out a small ‘gotcha’ to watch out for.
Go’s
pproftool is useful for more than just analysing heap profiles. You can read more about its capabilities here
Go provides a few ways to look at the memory usage of your programs. In this post I’ll discuss pprof.WriteHeapProfile which is a nice way to get a snapshot at a specific point in the execution flow of your program. However, Go also has http/pprof which lets you investigate heap usage at a point in time via an HTTP endpoint.
The Program
We need a small program to test.
If you want to follow along, I’ve created a repository here
Overview of what this program does:
- Walks the
demo-dirdirectory which contains 1 million files. - Increases a counter for each file visited & logs progress
- Outputs a heap profile on the first and last files visited
The most relevant part of the program for us is the following section:
1
2
3
4
5
6
7
8
9
10
11
12
13
14
15
16
17
18
19
20
21
22
23
24
25
26
27
28
29
30
31
32
33
34
	// Walk the demo directory.
	visitCounter := 0
	err = filepath.Walk(demoDir, func(path string, _ os.FileInfo, err error) error {
		if err != nil {
			// Stop walking if we get an error.
			return err
		}

		// Write heap profile on first visit
		if visitCounter == 0 {
			err := writeHeap(filepath.Join(outputDir, "first-visit.prof"))
			if err != nil {
				fmt.Println("Error creating heap during first visit")
				log.Fatal(err)
			}
		}

		// Write heap profile on last visit
		if visitCounter == 1_000_000 {
			err := writeHeap(filepath.Join(outputDir, "last-visit.prof"))
			if err != nil {
				fmt.Println("Error creating heap during last visit")
				log.Fatal(err)
			}
		}

		visitCounter++
		// Print to give an indication of progress
		if visitCounter%10_000 == 0 {
			fmt.Printf("Visited %d files \n", visitCounter)
		}

		return nil
	})
Go makes it nice and easy to write a heap profile at some point in our program to a file:
1
2
3
4
5
6
7
8
9
10
11
12
func writeHeap(filename string) error {
	f, err := os.Create(filename)
	if err != nil {
		log.Fatal(err)
	}
	defer f.Close()
	if err := pprof.WriteHeapProfile(f); err != nil {
		return err
	}

	return nil
}
This program outputs two heap profiles to disk:
- first-visit.prof
- last-visit.prof
Profiling with pprof
Go comes with a native profiling tool named pprof, we can use it to investigate these heap profiles.
Lets start by looking at the memory profile taken during the first file visit:
1
2
3
4
5
21:56 $ go tool pprof first-visit.prof
File: main
Type: inuse_space
Time: Nov 12, 2024 at 9:56pm (GMT)
Entering interactive mode (type "help" for commands, "o" for options)
Type defaults to inuse_space. There’s a few values we can use:
- inuse_space: The amount of memory currently in use by live objects (allocated but not freed)
- inuse_objects: The number of live objects currently in use in memory.
- alloc_space: The total amount of memory allocated (including both live and dead objects).
- alloc_objects: The total number of objects that have been allocated (includes both live and dead objects).
The top command summarizes allocations by function:
1
2
3
4
5
6
7
8
9
10
11
12
21:56 $ go tool pprof first-visit.prof

(pprof) top
Showing nodes accounting for 14.33MB, 100% of 14.33MB total
      flat  flat%   sum%        cum   cum%
   14.33MB   100%   100%    14.33MB   100%  os.(*File).readdir
         0     0%   100%    14.33MB   100%  main.main
         0     0%   100%    14.33MB   100%  os.(*File).Readdirnames
         0     0%   100%    14.33MB   100%  path/filepath.Walk
         0     0%   100%    14.33MB   100%  path/filepath.readDirNames
         0     0%   100%    14.33MB   100%  path/filepath.walk
         0     0%   100%    14.33MB   100%  runtime.main
web opens a graph of memory allocations in a browser:
1
(pprof) web
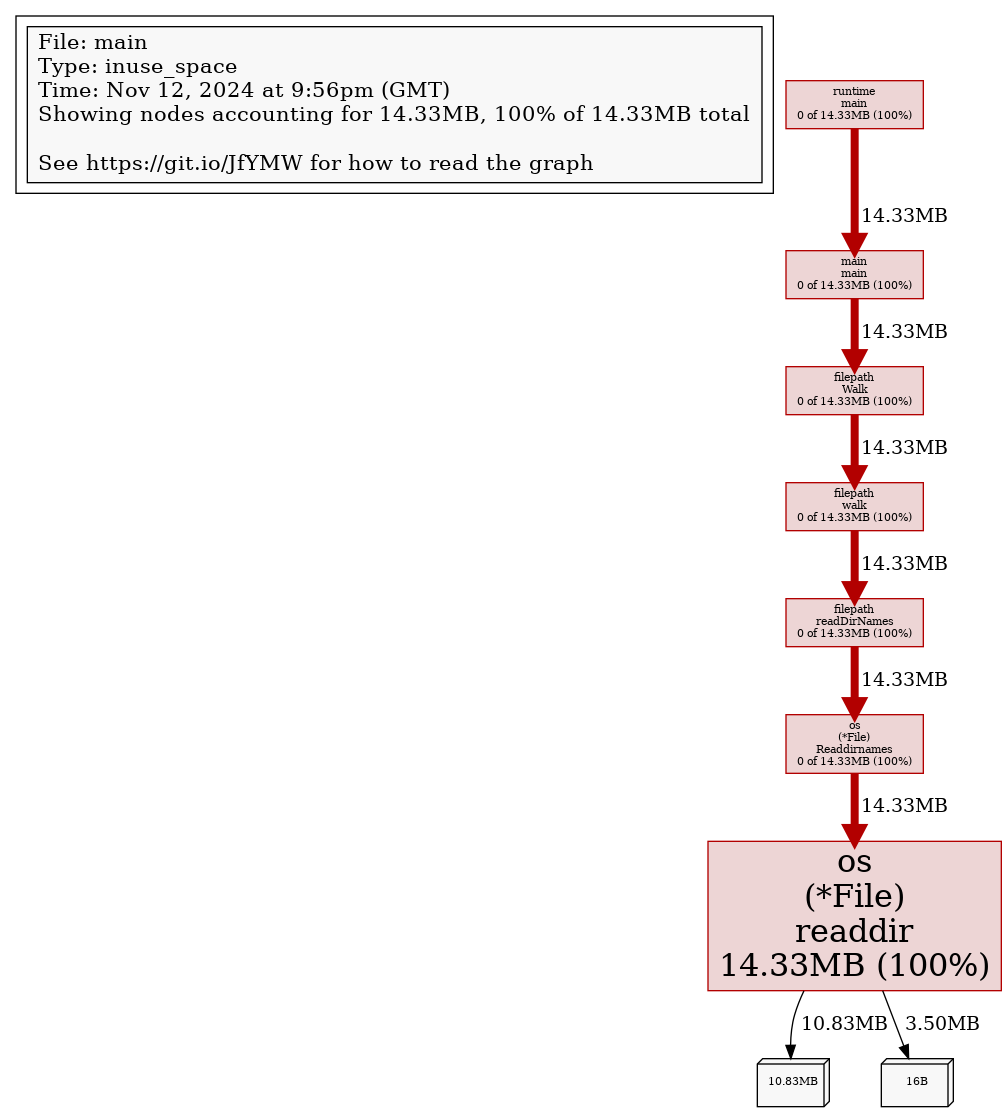
What does this show us? Walking the filesystem might seem fairly benign from a memory perspetive, but Go’s filepath.Walk provides lexical ordering guarantees.
In order to do this, Walk must read the entire directory into memory before proceeding to walk the directory.
We can see from the graph that memory has been allocated within the os.readdir call.
If you want, you can play around with the number of entries in the
demo-dirwalked by the program by modifying themake-demo-dir.shto get an idea of how memory grows with respect to the number of entries in the directory we walk.
Another useful command is: list <regex>
This command shows annotated source for a function matching the provided regex.
We’re interested in os.readdir here so lets try it:
1
2
3
4
5
6
7
8
9
10
11
12
13
14
15
16
17
18
19
20
(pprof) list readdir
Total: 14.33MB
ROUTINE ======================== os.(*File).readdir in /snap/go/10743/src/os/dir_unix.go
   14.33MB    14.33MB (flat, cum)   100% of Total
         .          .     47:func (f *File) readdir(n int, mode readdirMode) (names []string, dirents []DirEntry, infos []FileInfo, err error) {
         .          .     48:	// If this file has no dirInfo, create one.
         .          .     49:	d := f.dirinfo.Load()
         .          .     50:	if d == nil {
<<<< Redacted for brevity >>>>
         .          .    125:		}
         .          .    126:		if n > 0 { // see 'n == 0' comment above
         .          .    127:			n--
         .          .    128:		}
         .          .    129:		if mode == readdirName {
   14.33MB    14.33MB    130:			names = append(names, string(name))
         .          .    131:		} else if mode == readdirDirEntry {
         .          .    132:			de, err := newUnixDirent(f.name, string(name), direntType(rec))
         .          .    133:			if IsNotExist(err) {
         .          .    134:				// File disappeared between readdir and stat.
         .          .    135:				// Treat as if it didn't exist.
Pretty helpful huh?! We get this annotation showing us that the names slice is where our heap allocations happen in readdir:
1
   14.33MB    14.33MB    130:			names = append(names, string(name))
You can check out the source code for readdir here if you’d like to explore more.
Go uses the names slice returned from readdir to provide the lexical ordering guarantees mentioned earlier.
Lets see a bit of a ‘gotcha’ now.
Look at the heap taken during the last file visit:
1
2
3
4
5
6
7
8
9
10
11
12
13
14
go tool pprof last-visit.prof

(pprof) top
Showing nodes accounting for 24.93MB, 100% of 24.93MB total
      flat  flat%   sum%        cum   cum%
   24.43MB 97.99% 97.99%    24.43MB 97.99%  os.(*File).readdir
    0.50MB  2.01%   100%     0.50MB  2.01%  os.lstatNolog
         0     0%   100%    24.93MB   100%  main.main
         0     0%   100%    24.43MB 97.99%  os.(*File).Readdirnames
         0     0%   100%     0.50MB  2.01%  os.Lstat
         0     0%   100%    24.93MB   100%  path/filepath.Walk
         0     0%   100%    24.43MB 97.99%  path/filepath.readDirNames
         0     0%   100%    24.93MB   100%  path/filepath.walk
         0     0%   100%    24.93MB   100%  runtime.main
This seems a little surprising.
1
   24.43MB    24.43MB    130:			names = append(names, string(name))
We’d expect that readdir should have done all of its allocations before the first file visit, so why the difference?
The answer can be found in pprof’s source docs: 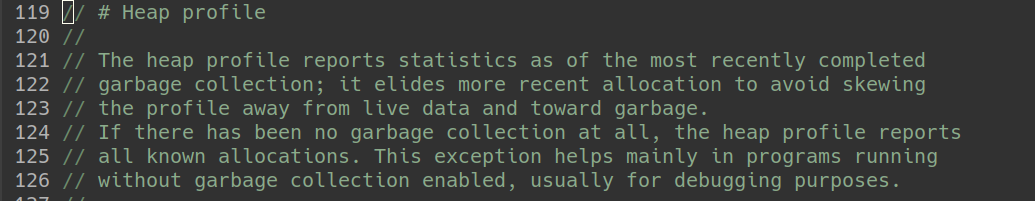
From this we can surmise that the most recent GC when the first heap profile was written must have happened while the call to readdir was happening, but before it had allocated all of the entries in the names slice.
Given that heap profiles are representative of the most recently completed GC, lets make a small update to our code.
We can use runtime.GC() to force a GC before we write our first heap profile:
1
2
3
4
5
6
7
8
9
		// Write heap profile on first visit
		if visitCounter == 0 {
			runtime.GC() // Force a GC before writing a heap profile on the first visit
			err := writeHeap(filepath.Join(outputDir, "first-visit.prof"))
			if err != nil {
				fmt.Println("Error creating heap during first visit")
				log.Fatal(err)
			}
		}
For good measure, we will also force a GC before writing the last heap profile too, just to prove out that our
readdirallocations stay ‘live’ throughout the entire walk:
Lets compare heap profiles after running with these changes:
1
2
3
4
5
6
7
8
9
10
11
12
13
14
15
16
17
18
19
20
21
22
23
24
25
26
27
28
29
30
31
32
33
34
35
36
37
$ go tool pprof first-visit.prof
File: ___1go_build_main_go
Type: inuse_space
Time: Nov 14, 2024 at 8:13pm (GMT)
Entering interactive mode (type "help" for commands, "o" for options)
(pprof) unit=bytes
(pprof) top
Showing nodes accounting for 25648064B, 99.87% of 25681408B total
Dropped 29 nodes (cum <= 128407B)
      flat  flat%   sum%        cum   cum%
 25648064B 99.87% 99.87%  25657440B 99.91%  os.(*File).readdir
         0     0% 99.87%  25657440B 99.91%  main.main
         0     0% 99.87%  25657440B 99.91%  os.(*File).Readdirnames
         0     0% 99.87%  25657440B 99.91%  path/filepath.Walk
         0     0% 99.87%  25657440B 99.91%  path/filepath.readDirNames
         0     0% 99.87%  25657440B 99.91%  path/filepath.walk
         0     0% 99.87%  25657440B 99.91%  runtime.main
(pprof) exit

$ go tool pprof last-visit.prof
File: ___1go_build_main_go
Type: inuse_space
Time: Nov 14, 2024 at 8:14pm (GMT)
Entering interactive mode (type "help" for commands, "o" for options)
(pprof) unit=bytes
(pprof) top
Showing nodes accounting for 25648064B, 99.87% of 25682392B total
Dropped 57 nodes (cum <= 128411B)
      flat  flat%   sum%        cum   cum%
 25648064B 99.87% 99.87%  25648064B 99.87%  os.(*File).readdir
         0     0% 99.87%  25658408B 99.91%  main.main
         0     0% 99.87%  25648064B 99.87%  os.(*File).Readdirnames
         0     0% 99.87%  25658408B 99.91%  path/filepath.Walk
         0     0% 99.87%  25648064B 99.87%  path/filepath.readDirNames
         0     0% 99.87%  25658408B 99.91%  path/filepath.walk
         0     0% 99.87%  25658408B 99.91%  runtime.main
Et voilà! The in-use allocations are equal now.
On first impressions, it might seem a little odd that runtime.GC() results in an increase in what our heap profile contains on the first file visit.
However, from reading the docs we know that we simply get a more up to date and relevant heap profile by doing so.
So, as a final takeaway, if you care about getting the most recent snapshot possible, take care to call runtime.GC() before you write your heap profile!